Forget the S&P 500 for a moment. Hold your breath and take a leap into my hypothetical parallel universe where there are only two companies: Apple and IBM. In this universe the most popular investment product is the S&P2 Index. It has been the gold standard for generations. Michael Burry, David Tepper, Chuck Acre and Ray Dalio have ALL failed to beat the S&P2 Index over the past decade. David Einhorn was beaten by the S&P 2 so badly that he closed up his fund and moved to Atlanta, GA where he is pursuing a new goal of becoming the world’s oldest and longest practicing contortionist in the hipster area around Little 5 Points.
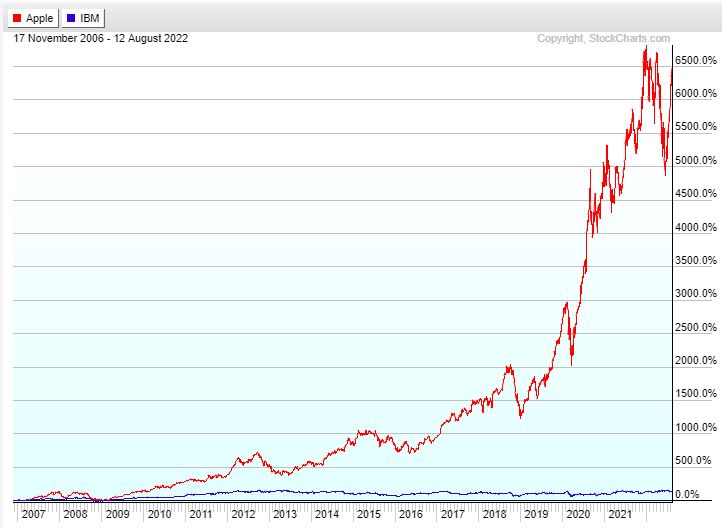
Enter Ben Buchanan. Ben is not the smartest or savviest guy around. He doesn’t have the financial acumen of any of the aforementioned fund managers, nor does he like to work the 80 hour weeks so many on Wall Street are famous for. BUT, he also has no ego and no ability to charge 2/20. He is therefore free to try to beat the S&P 2 Index without the shackles normally placed on fund managers. One day he’s looking at the only chart CNBC ever puts on TV - the side-by-side comparison of the only two stocks that have ever existed, Apple and IBM:
Technical and fundamental analysts a like have spent countless hours staring at this chart, trying to divine its meaning. Instinctively everyone seems to know that there is a message hidden in here somewhere, but the endless debates on CNBC have not produced any definitive conclusions over the past few decades.
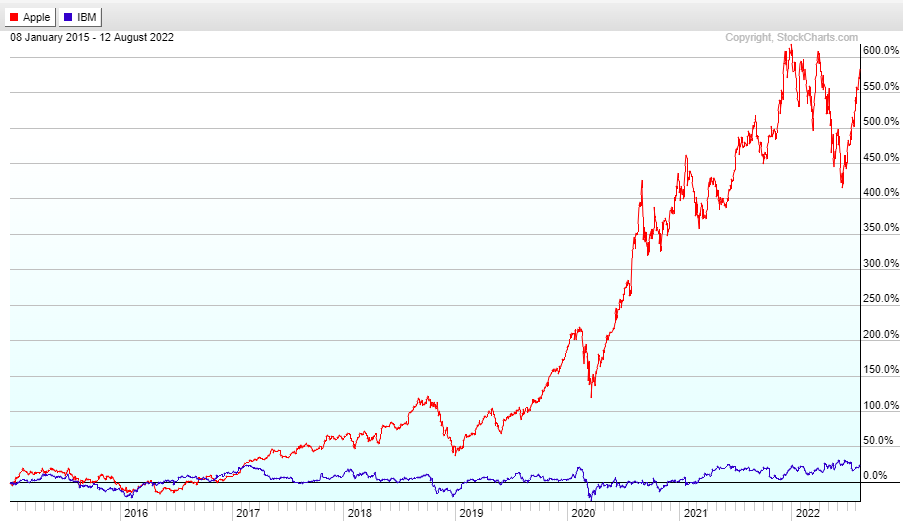
Suddenly when looking at the chart Ben is struck by an idea. He pulls up the same comparison but over a different time frame: 2015-2022
His heart starts to beat faster. He wants to make sure the chart isn’t being skewed by some recent events that might not be reliable in the future. He picks another time frame at random: 2005-2013
His heart feels like it’s about to pop out of his chest. He decides to check out just one more time frame to be certain: 2012-2019
He jumps out of his chair knocking his coffee all over his computer in the process, short-circuiting it immediately. But he doesn’t care. He knows he will be rich. He has just figured out how to beat the S&P 2 Index.
“IBM really is a shitty company isn’t it”. He thinks the words in his head, still too scared to bash one of the components of the heralded S&P 2 Index out loud. But it rings true. He starts thinking about the business. It’s really…more like a…consulting firm than a technology company. There’s really…nothing…attractive about their financial statements? Their business has been shrinking consistently for like…10 years?
He finally says it out loud: “IBM is a shit company.”
He writes the following down on a napkin in front of him: “IBM is a shit co” - abbreviating the word company.
Shitco - I like that, he thinks to himself.
The next day Ben walks proudly down to CNBC headquarters and informs them he has once and for all figured out how to beat the S&P 2 Index. He explains his process while writing the following on a whiteboard:
Start with the index itself.
Remove the shitco
Reinvest the money you get from the shitco back into the remaining company
Joe Kernan and Becky Quick are dumbfounded. Joe invites Ben to Sunday barbecue. Becky immediately leaves the room to call Warren Buffett to get his opinion. Jim Cramer just starts bowing up and down as if he’s seen the second coming of Christ. Steve Liesman calls up Jerome Powell and Janet Yellen, terrified that rebalancing the S&P 2 Index is going to cause the markets to go haywire. Andrew Ross-Sorkin asks Ben if he’d like to guest star in the upcoming season of Billions. It’s pandemonium. Everyone realizes it’s going to work.
Stock indexes are great products. I made this slide for a presentation I gave years ago and it’s still true today.
I wrote a similar post called How to Beat The QQQs and created an index based off of that post that I invested my entire 401(k) into. The introduction to that post explains in more detail why indexes work so fabulously, so I won’t make the same points here. Suffice it to say that if you beat the index over a long period of time you are doing better than 90% of professionals (including the top hedge fund managers).
The secret to reliably beating an index is not stock-picking. It’s stock-avoiding. It is far easier to identify shitcos than it is to identify companies which will beat the index long term. In the rest of this post I’m going to walk through which companies we can safely remove from the index and what to do with the money we free up.
The first thing we have to do is decide our starting universe of businesses. The most logical starting point would be to begin with all 500 companies in the S&P500 index. This would be quite daunting. Even after following markets for 20 years I am unfamiliar with most companies outside of the top 150 or so. Thankfully, we don’t need to start with all 500. Here’s why. There is such a thing as the S&P100 index AND the S&P50 index. Their performance over time has been remarkably similar:
Despite what much of financial literature says about smaller caps needing a higher “risk premium” and hence being likely to outperform larger caps over time - at least within the universe of the S&P 500 the opposite has been true. Here are the rolling 5 year returns comparing the top 50/100/500 stocks since 2011:
Both the 50 and the 100 have outperformed the 500. Interestingly, their outperformance is increasing with time.
Much of the outperformance is due to the tech giants. H/T to @Miser191 on Twitter for sending these charts my way.
Immediately a question begs, moving forward can we expect the same to hold true? Will the 50 and the 100 keep on beating the 500?
I think the answer is a resounding yes. Even if the FAANGM companies are displaced (unlikely), the same dynamics that allowed them to reach trillion dollar + market caps will remain.
FAANGM got so big because their products service almost unimaginably large total addressable markets (TAMs) (Search, Social, Cloud, Operating Systems, etc) AND technology tends to create winner-take-all or winner-take-most dynamics.
The future will be defined by companies that dominate the aforementioned TAMs PLUS… [AI], [the Cloud], [5G], [next generation semiconductor], [augmented reality], [machine vision / robotics], etc.
These TAMs will also be unimaginably large.
Put together, the size of the TAMs + winner-take-all dynamics mean that top performing companies will have plenty of room to run for many years after entering into the top 50 or 100 companies. Consider the following: Getting into the top 100 companies today requires reaching a $75billion market cap.
Here are the current market caps of Apple, Microsoft, Amazon, Tesla and Meta (Facebook):
Apple: 2.766T (37X 75B)
Microsoft: 2.177T (29X 75B)
Amazon: 1.462 (19X 75B)
Tesla: 940B (13X 75B)
Meta: 485B (6X 75B)
We’re going to start with the 150 largest companies in the S&P 500 because I am already familiar with most of them, and we’ll probably end up with around 75 businesses - which is still a very attractively diversified portfolio.
For what it’s worth, in my opinion the likeliest way this process breaks long term is: a mass coincidence of shitco turnarounds the likes of which the world has never seen before. Unlikely.
Let’s get started.
The first thing we’re going to do is eliminate companies in any of these sectors:
Commodities (or closely tied to commodities)
Materials
Financials
Utilities
Communications
Companies in these sectors might reduce volatility during certain economic cycles (e.g oil and gas during inflation) but there is little chance of them keeping up with the index long term. They are fundamentally less attractive businesses with worse returns on capital.
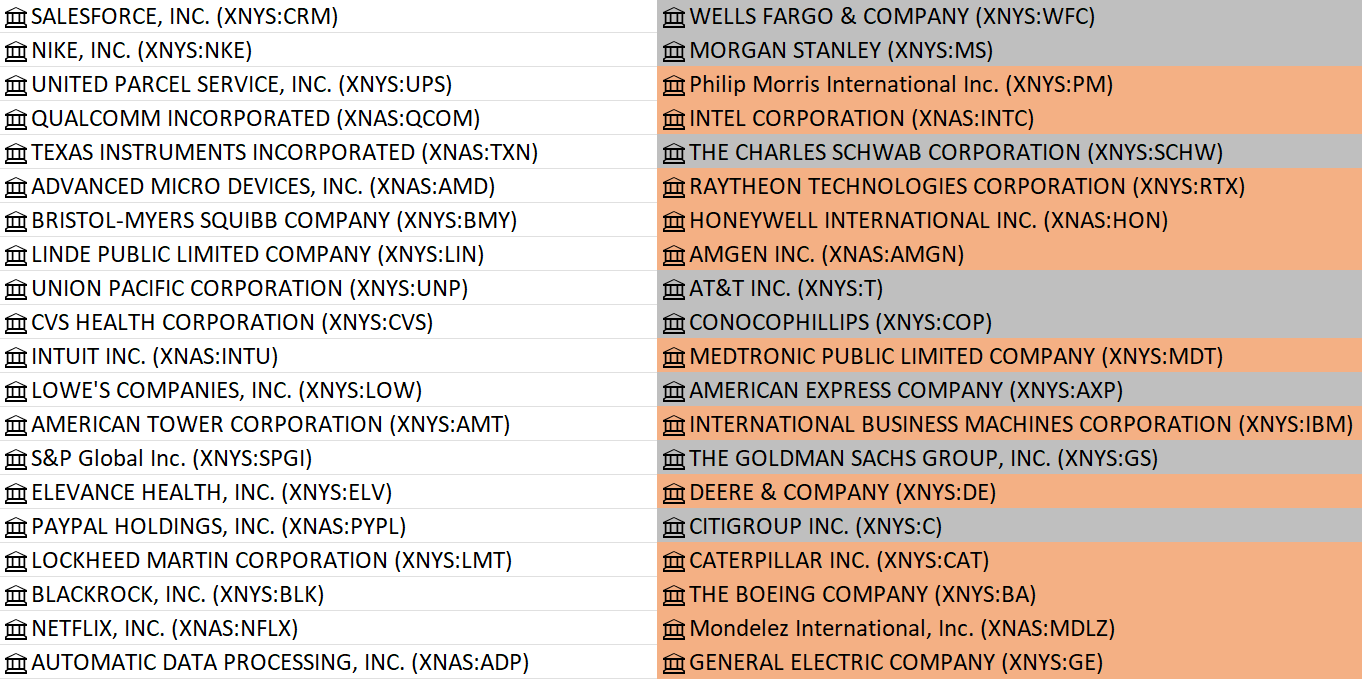
Here’s our starting list of companies with each of the companies we’re removing highlighted in gray:
35 companies gone.
Now I’m going to remove any company that didn’t grow by 5% or more annualized over the past 5 years. I’m accounting for acquisitions - so a company wouldn’t get credit for growing through an acquisition unless the acquired company + their core business growth > 5%. I also stripped out Covid-19 related revenue. Lastly, there were some exceptions where I took out companies that met the growth target but it was due to some wonky year to year comparison and wasn’t reflective of a business that’s actually meeting our metric over time.
Coincidentally, 35 more companies gone.
I did break my own 5% revenue growth rule here with respect to the railroads. They have done a phenomenal job improving efficiency and growing EPS faster than the S&P even though they haven’t met the revenue target. They get a pass.
Here is the entire list organized now by annualized returns over the past five years:
Obviously you would expect there to be an enormous correlation between positive 5 year revenue growth, non shitco sectors, and performance. Also, in doing this research I noticed (but didn’t track) that there was a lot of overlap between the sectors we removed (which I left in gray) and companies that didn’t grow revenue at 5% - not surprising.
I want to comment some on the anomalies. Moderna is obviously a standout. I removed them from the index because all of their revenue is due to Covid-19 and they are otherwise an unproven business. Analyst estimates for their revenue next year range from 3.99B (low) to 18.61B (high) with an average of 10.71B. For perspective their revenue in 2021 was 18.5B.
I’m not sure what the deal is with Eli Lilly, it was taking me too long to figure out so I just moved on. If you know please find me on Twitter and fill me in! They didn’t meet the revenue target without acquisitions though.
John Deere’s revenue and EPS are all over the place (with a downside tilt) and it basically didn’t grow for the 10 years before Covid. It seems unlikely to repeat this performance.
Progressive’s run has been one for the history books. Hat off to them. Their multiple has expanded but I’d say most of the run is deserved and unexpected. They’re the only financial we would have suffered by not having. Still a fine price to pay to avoid the other dogs.
NextEra Energy is obscenely overvalued and a cult stock, it won’t repeat that performance.
Conoco Phillips did so well because it had done so poorly before hand. Almost on the day my performance data started it bottomed in a 62% drawdown. Won’t be repeating.
I won’t keep going, but I do want to point out we can also do this same exercise for the companies that stayed in - which obviously won’t be repeating their performance. Tesla first and foremost. In fact, I’d be surprised if any of the top 75 companies beat their own performance over the past five years. What won’t surprise me though is if the companies we kept as a basket continue beating the companies we removed. They are simply superior businesses qualitatively.
I ran the performance numbers on the “kept basket” and the “removed basket”. For the kept basket I excluded Tesla and AMD as they were unusual in the extreme.
Average Return Kept Basket: 19.33% annualized
Median Return Kept Basket: 18.58% annualized
Average Return Eliminated Basket: 9.25%
Median Return Eliminated Basket: 9.7%
S&P 500 Return: 13.8%
Here’s another view of the companies we kept vs the companies we eliminated. I organized them by market cap and matched the largest companies we kept with the largest companies we eliminated. I’m going to show them in batches of 20.
Which would you rather own? It’s super obvious for the first 20.
This one is also obvious. Wells Fargo, Intel, AT&T, IBM, Goldman Sachs and GE all in the same group? Absolute Shitco fiesta going on in this basket…
LOLOLOLOOLOL I actually chuckled out loud when I started reading through this basket. 3M, Gilead, Altria, Truist, Colgate, General Dynamics AND Ford in the same group - I know it’s just a coincidence that I grabbed these 20 together but dear lord this is an absolute UNIT of Shitcos…
Meh - mostly utilities and commodities companies - not their fault they were born that way…
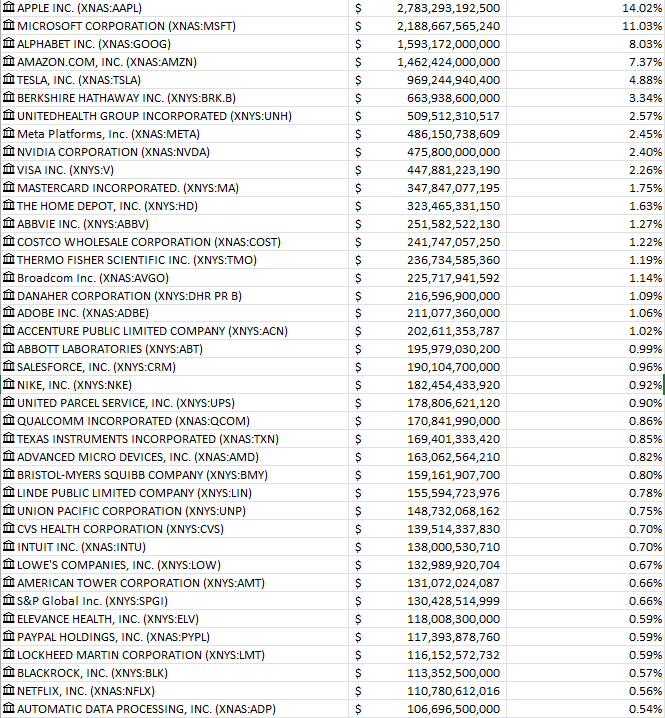
Here’s our total portfolio along with the weightings if all we did was market cap weight the remaining companies:
I know some people will have concerns about the size of the top positions. Remember that our goal is to beat the S&P 500. We will succeed because we removed the shitcos and reinvested those funds back into a better basket of businesses. However, we do NOT have to reinvest the funds according to the exact same weightings of the remaining components. There are two important rules we need to follow in order for our process to work over time:
We must never reduce single stock weightings below their weighting in the S&P500 index itself. This ensures that we will have at least index exposure to any company that goes on to be a runaway winner.
We must not interfere with the magic of market cap weightings (letting winners run and letting losers automatically cut themselves).
Let’s walk through a hypothetical which is what I’d do if I were trying to reduce the risk a little bit.
I’d cap the weightings of all companies at 10% (unless they were weighted higher in the S&P500 index, then I’d stick to the index weighting).
I’d reduce Tesla’s weighting to the 500 index weighting.
This frees up:
4.02% from Apple
1.03% from Microsoft
2.79% from Tesla
I’d redistribute that cash according to market cap weightings of the remaining constituents. Here’s the final product:
Beautiful isn’t it?
To close this post I’m going to run through a napkin math exercise to help us think through what difference this laborious process might make to our long term returns.
Our average return from our Kept Basket was about 20%, and the average return from our Eliminated Basket was about 10%. This is a ratio of 2:1. That’s a very healthy level of outperformance and probably unlikely to repeat so I’m going to knock it down a bit. Let’s assume the ratio is 1.5:1 instead.
Let’s further assume that long term the S&P500 does 9% instead of 14%.
Lastly, we removed 33.5% of the top 150 companies by market cap and kept 66.5%.
We can now write the following equation to figure out what the annualized returns would be for our portfolio based on a 9% return for the S&P 500:
[1.5 X R Eliminated (Kept returns are 1.5X the returns of the Eliminated companies) X 66.5% (Kept weighting)] + [R Eliminated X .335] = .09
Solving for our R Eliminated gives us: 6.754%
This gives us 10.131% (1.5 X 6.754) for R Kept - meaning this is the return we’d expect from our basket based on a 9% return for the S&P500 as a whole. Essentially, using some figures that are materially more conservative than what happened over the past five years, we could expect to beat the market by about 1%.
10.131% / 9% = 12.57%. 12.57% is the annual outperformance we would expect over the S&P500. Meaning, if the S&P500 did 6% instead of 9% then we would expect: 6% X 1.1257 = 6.754%. You can pick and choose your return from the S&P500 and multiply by 1.1257 to see what the kept basket might do.
Remember this is napkin math, not a forecast.
Just for fun I went through the process starting with the top 50 stocks. However, this time instead of capping the top weighting at 10% I capped it at the weightings of the QQQ or 10%, whichever was higher. I also took Tesla back to the S&P weighting. Here’s that final portfolio:
Not too bad lookin is it?
If you wanted to further diversify the portfolio it’s more work but the results probably won’t be better. Fewer companies means higher concentrations in the runaway winners, and I expect we’ll see a $10T market cap sometime in the next 10-15 years (that’s a 14% annualized return for Apple if it hits in 10 years, or a 9% return if it hits it in 15).


I love this post! Have been trying to create something similar...I was able to screen for 5% (or greater) growth using Fidelity/TDA scanners, but is there a quick method or tool you used to calculate the cash distribution based on the market cap weightings of your final picks? Interested in doing something similar myself, but if my stock selection varies slightly, it throws off the numbers. Thanks!
my strategy is to look at capital allocation decisions and financial statements of sp500 components and eliminate those that I feel have poor management or decisions. Yes there are quite a few companies that are being silly. I choose the subset I feel are more intelligent.