Stats, commentary & perspective on the R&D, Capex, Time Share, Revenue & Market Cap of the biggest companies in each category
Research and Development & Capex
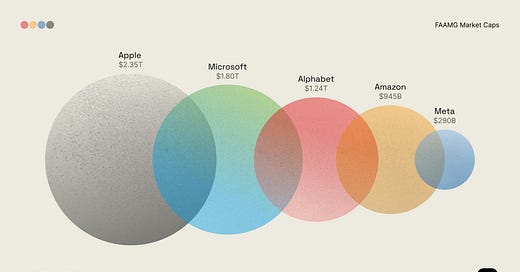
This graphic comes from @Quartr_App on Twitter (follow them if you don’t already). It shows the market caps of each company as of a couple weeks ago.
These are the top 5 spenders on research and development in the entire world (data pulled from Koyfin). The table below shows the top 10 spenders on R&D, and is ordered by 12 month trailing R&D spend (third column from last).
Note that Amazon doesn’t report an R&D category, instead reporting “Technology and Content” - which includes a truck load of stuff that isn’t R&D. Still, my guess is it would be near the top of the list even after adjustments.
To put some perspective around these figures, in 2010 the largest spender on R&D globally was Roche, which laid out $9.6B in 2010 dollars - this equates to around $13.15B in 2022 dollars. Rounding out the top 5 spenders in 2010 were (in 2022 $):
Roche: $13.15B
Pfizer: $12.92B
Microsoft: $11.93B
Novartis: $11.16B
Merck: $11.29B
Collectively, the top 5 in 2010 spent: $60.46B vs. $131.49B today (I gave Amazon credit for the same R&D spending as Microsoft). Switching out Amazon for Intel (no chance Intel R&D is bigger, but wanted to see the calculation) would give us: $123.45B - still more than a double in real terms over the past 12 years.
If we instead organized the table by combining R&D+Capex (the final column) we get the following for the top 10:
Apple drops out of the top 5 and is replaced by intel (though this will likely be reversed next year).
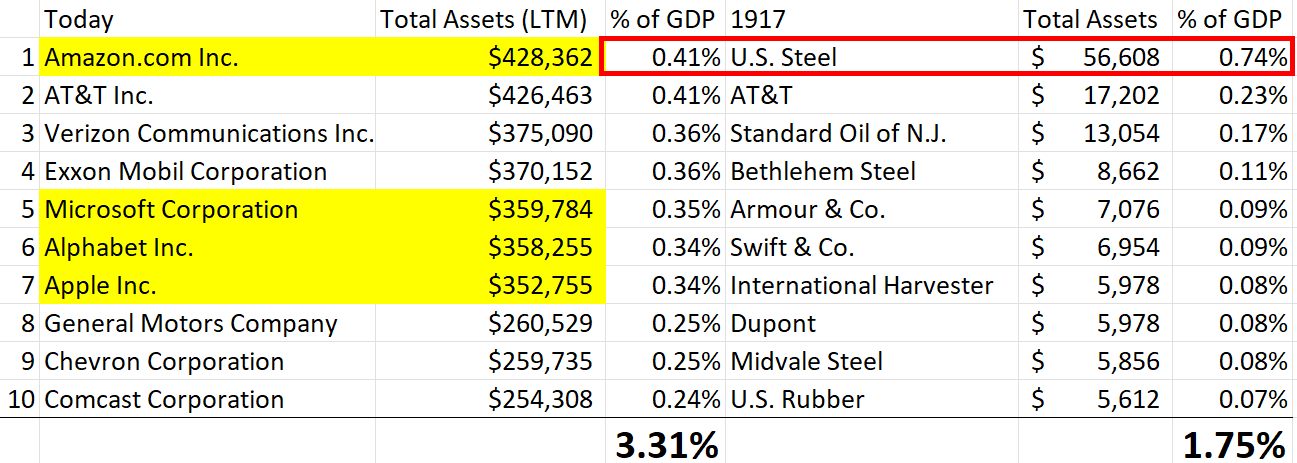
Unsurprisingly, with the exception of Meta these companies also top the list of biggest companies as measured by assets on the balance sheet. I excluded state owned companies, holding companies and financials.
Here’s a chart looking at asset values both in absolute terms and as a percentage of GDP.
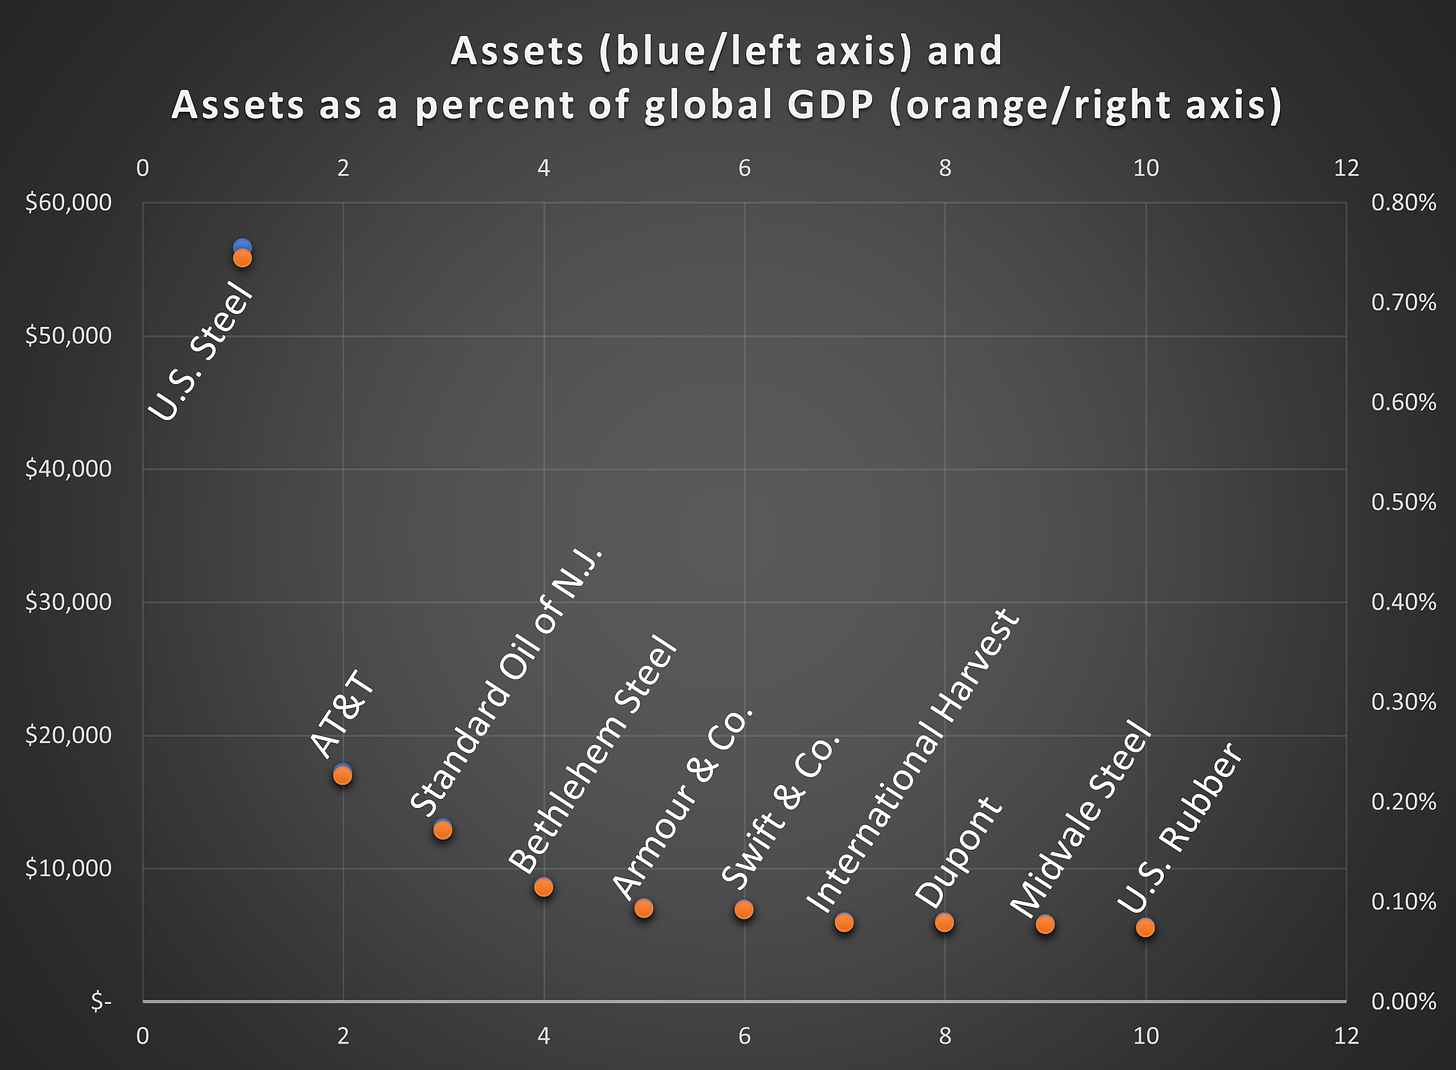
Here’s the same chart except looking at the assets of the ten largest companies by assets in 1917 (figures HAVE been adjusted for inflation):
Note, orange dots are mostly covering up the blue dots.
Even Meta has assets equal to more than 3X that of U.S. Steel after adjusting for inflation. Amazon has more than 7.5X the assets. Interestingly, if we compare the assets against GDP at the time U.S. steel was actually larger proportionately than Amazon:
U.S. Steel was in a league of its own (Standard Oil would have been close to or larger than U.S. Steel had it not been broken into 34 separate entities by the Sherman Antitrust Act). I found it interesting how the gap between the largest company by assets and the 10th largest has shrunk.
Time spent
Using some assumptions similar to those I outlined in this post on Apple and this post on Google, I estimate that people around the world will spend around 14.5 trillion hours in 2023 using products from one of these 5 companies. There is some overlap embedded in this figure.
First example, if you are using a Meta product you are either doing it on a mobile phone or computer. The 14.5 trillion calculation gives Apple and Google credit for time spent on phones (iOS + Android) but also gives Meta credit for time spent on their apps.
Second example, many people are using two products simultaneously, e.g. scanning Instagram on an iPhone while watching Amazon prime (Instagram gets credit, Apple gets credit, Amazon gets credit).
I won’t re-hash the assumptions for Apple and Google which you can find in those posts, but here are the highlights:
Google
6.57 trillion hours from Android
1.19 trillion hours from Chrome
.182 trillion hours from YouTube
Total Hours so far: 7.942 trillion hours.
I think it’s safe to say that if you include use of other Google products NOT being used on an Android OS we can get to 8 trillion hours per year.
Apple
iPhones: 2,190 hours X 1,100,000,000 = 2,409,000,000,000 (2.4 trillion)
Macs: 1,825 hours X 310,000,000 = 565,750,000,000 (565.75 billion)
Watch: 91 hours X 110,000,000 = 10,010,000,000 (10.01 billion)
iPad: 182 hours X 400,000,000 = 72,800,000,000 (72.8 billion)
Total time spent: 3,057,560,000,000 (3.06 trillion).
Microsoft (assumptions included)
76% market share of 2 billion PCs: 1.52 billion PCs running windows
Average daily use of 4 hours (could be low?)
1.52B X 4 X 365 = 2.2192T hours.
This figure is likely an under estimate. It doesn’t include:
Time spent on websites that run on Azure
Time spent on other products (e.g. Office 365, LinkedIn) on non-Windows platforms
Gaming
Amazon (assumptions included)
Amazon is the minnow in this category. Here are some quick napkin-math calculations:
People spend around 72B hours per year watching Netflix - which runs on AWS
There are an estimated 191,000,000,000 (191B) minutes of TV streamed weekly. Amazon has around 19% share. This equates to around 31.45B hours per year.
AWS runs the internet. I think it’s conservative to assume that on top of Prime Video and Netflix there is at least another 100B hours out there.
Meta (assumptions included)
Facebook DAU: 1.98B
Instagram DAU (rough guess): 1.5B
WhatsApp DAU: 2B
Hours spent per app per day: .5
Total hours spent per day = (1.98B + 1.5B + 2B) X .5 = 2.74B
Total hours spent per year = 2.74B X 365 = 1.00T
Summary (in order of time spent)
Google: 8T
Apple: 3.1T
Microsoft: 2.22T
Meta: 1T
Amazon: .2T
Total: 14.5T
Mark Zuckerberg was the first person to ever comment (to my knowledge) that one of the most important things tech companies would fight over in the future would be consumers’ time.
There are a few comments I want to make here.
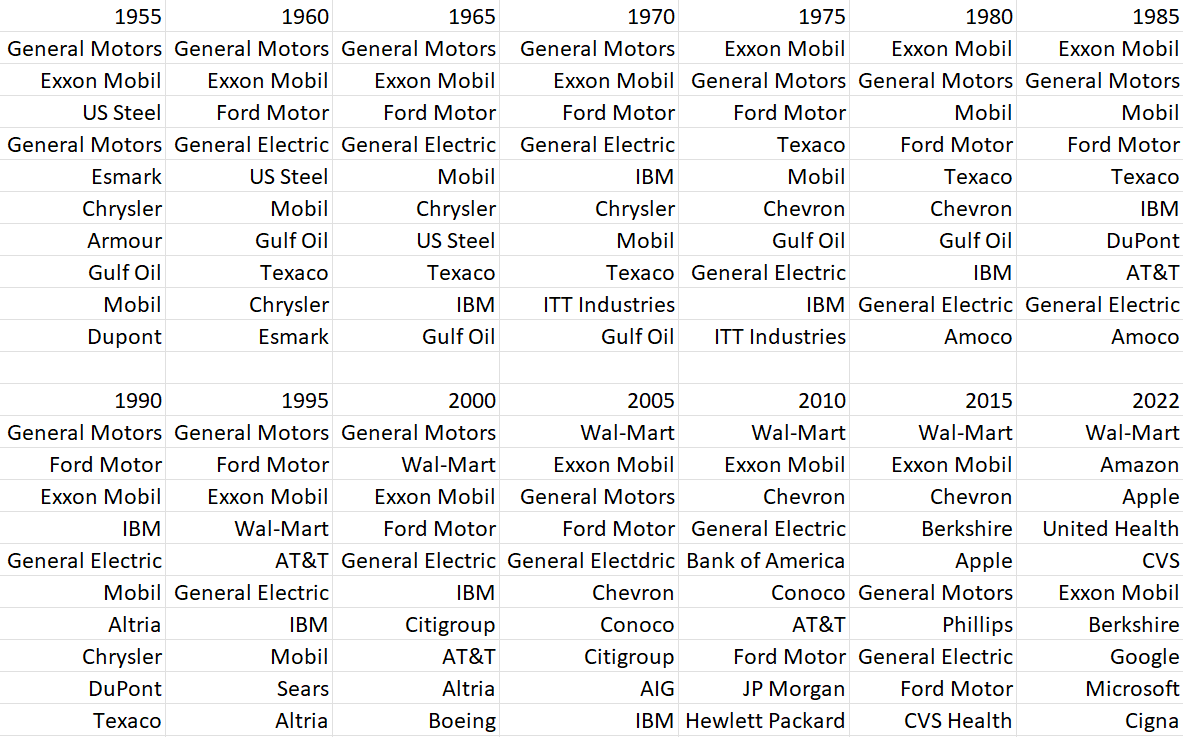
First, there is no precedent for this amount of time being spent on products of single companies. I pulled this list of the top 10 companies by revenue going back to 1955 from Fortune:
Obviously none of the companies on the list account for even a rounding error of the time spent inside the Big 5’s products.
You could make an argument that on a per user basis more time was spent in a GM product (a car, 2 hours per day?) than on Meta products (1/2 hour per day). But that’s beside the point. On a total time basis far more time is being spent across these platforms by many orders of magnitude than on any products from companies in the past. This is in part due to their ubiquity, but also because their products are mostly platforms of one sort or another, with many different use cases. The iPhone is the prime example - a remote control for your life (heard this quote recently but forgot who said it, apologies for not giving credit where it’s due).
Second, owning an operating system is obviously the most powerful tool to capture consumer time (See figure for Android, iOS, and Windows above). Even Meta with its ridiculous user numbers has a time share less than half of Microsoft’s. I expect these businesses (Apple/Google in particular, and to a lesser extent Microsoft) to continue finding new ways to monetize this amount of consumer attention, and think the net result will be that the TAMs of operating systems (and the things they enable, e.g. app store control) continue to surprise to the upside over the coming years.
Third, time represents an opportunity for monetization. To date time has been directly monetized mostly through digital advertising. Indirectly, time becomes a component of a business’s moat. Long before Apple got into the ad business it benefitted from consumers spending more time on their phones because that time drew in app developers (businesses go to where the consumers are, duh), more apps in turn made iPhones increasingly attractive - a virtuous cycle. Now Apple in particular is doing more than ever to monetize time (see their skyrocketing ad revenue growth). The more successful Apple is in advertising and growing their services business - the more incentive they will have to expand their device portfolio to reach lower income users and lock them into the ecosystem - knowing they can monetize them outside of the device margin.
Final thought. I’m going to conclude this section with a brief comment about the potential impact of large language models (LLM) like ChatGPT3 on the tech giants.
I’ve said before that the impetus for Apple’s privacy campaign was Apple being terrified that Facebook was responsible for determining (via ads, sharing, etc on their apps) greater than 50% of downloads on the App store. It had nothing, zero, zilch, NADA to do with privacy, and does NOTHING to protect privacy, but I digress. The App store is the single most crucial component of Apple’s moat. Facebook had become a layer that sat between Apple and one of the most core activities of its users (downloading apps).
There’s little doubt that LLMs over the next few years will make Siri, Alexa, “Hey Google”, etc in their present forms useless relics by comparison. I do not think this means that an incumbent tech start-up will be able to threaten the tech giants (if you disagree please email me, find me on Twitter or comment below, I’ve been thinking a lot about this and would love to engage in a debate with a devil’s advocate). What seems more likely is that the tech giants will begin competing with each other to build truly personalized, conversational assistants that communicate like Chat GPT3, but which are also connected to all of the information on the internet and all of our personal information. LLM based assistants have an obvious opportunity to become a new, primal layer through which consumers:
Communicate
Discover products
Plan vacations
Conduct research
Write code
The list goes on…
This is incredibly exciting because if one assistant becomes better than the rest by a noticeable margin then its value proposition would be so high their use would become ubiquitous. The prize is so large and the threat so great that we can expect the competition and innovation in the space to be extreme - consumers will be the biggest winners along with the companies that come to dominate this new platform.
Revenue
Older investors will remember that near the top of every bull market discussions abound about the fundamental limits to company size. The law of large numbers - yada yada yada.
Two things are true simultaneously.
Companies today are bigger than they have ever been in real terms (this holds true looking at market value, assets, revenue, the metric doesn’t matter)
Companies are not larger (at least by revenue) than you would expect relative to the size of the global economy if you simply forecasted a continuation of historical trends
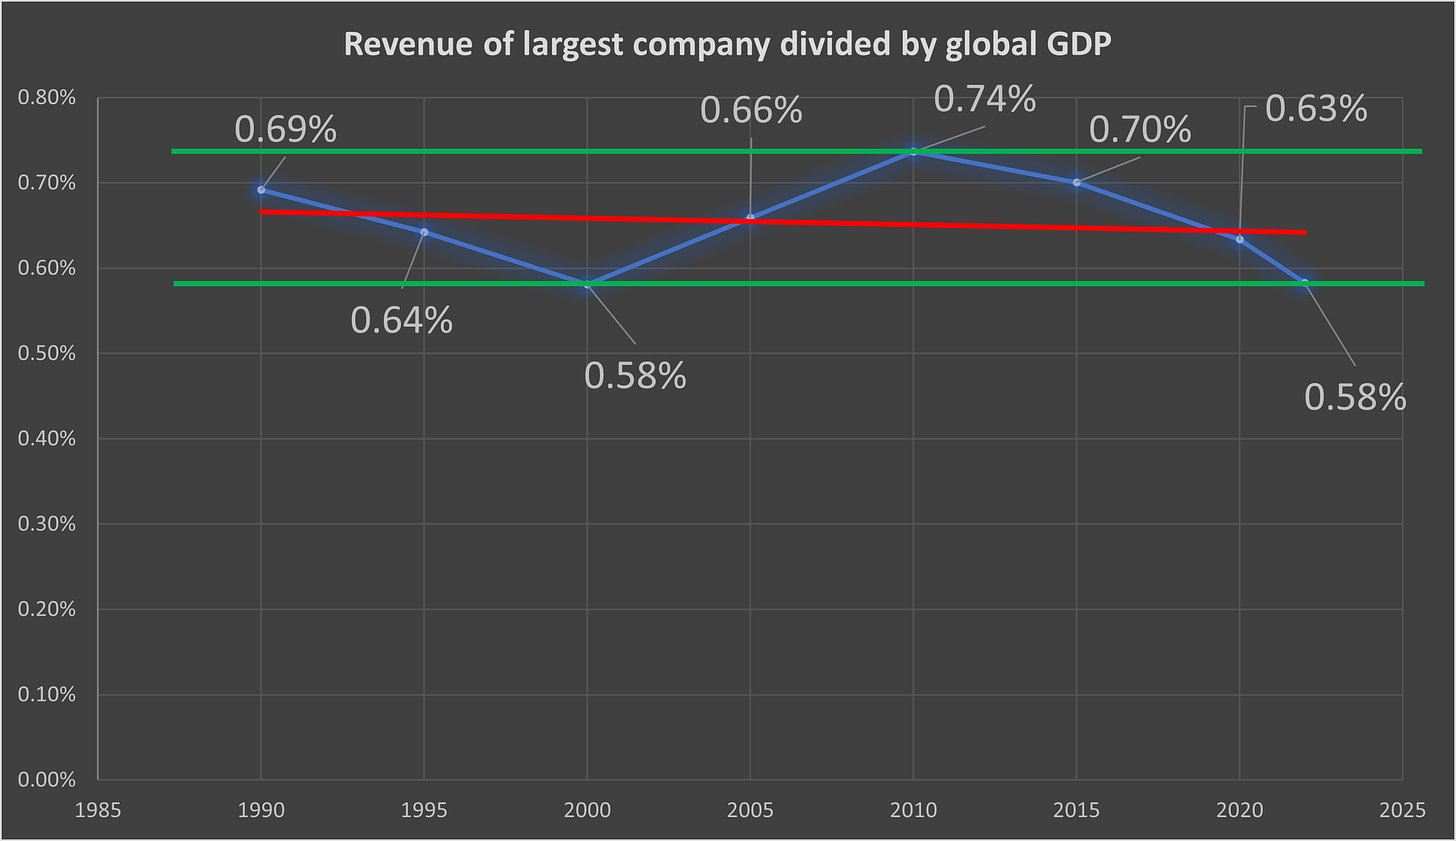
This chart shows the revenue of the largest US listed company by revenue divided by global GDP going back to 1955 (revenue data came from Fortune’s 500 list):
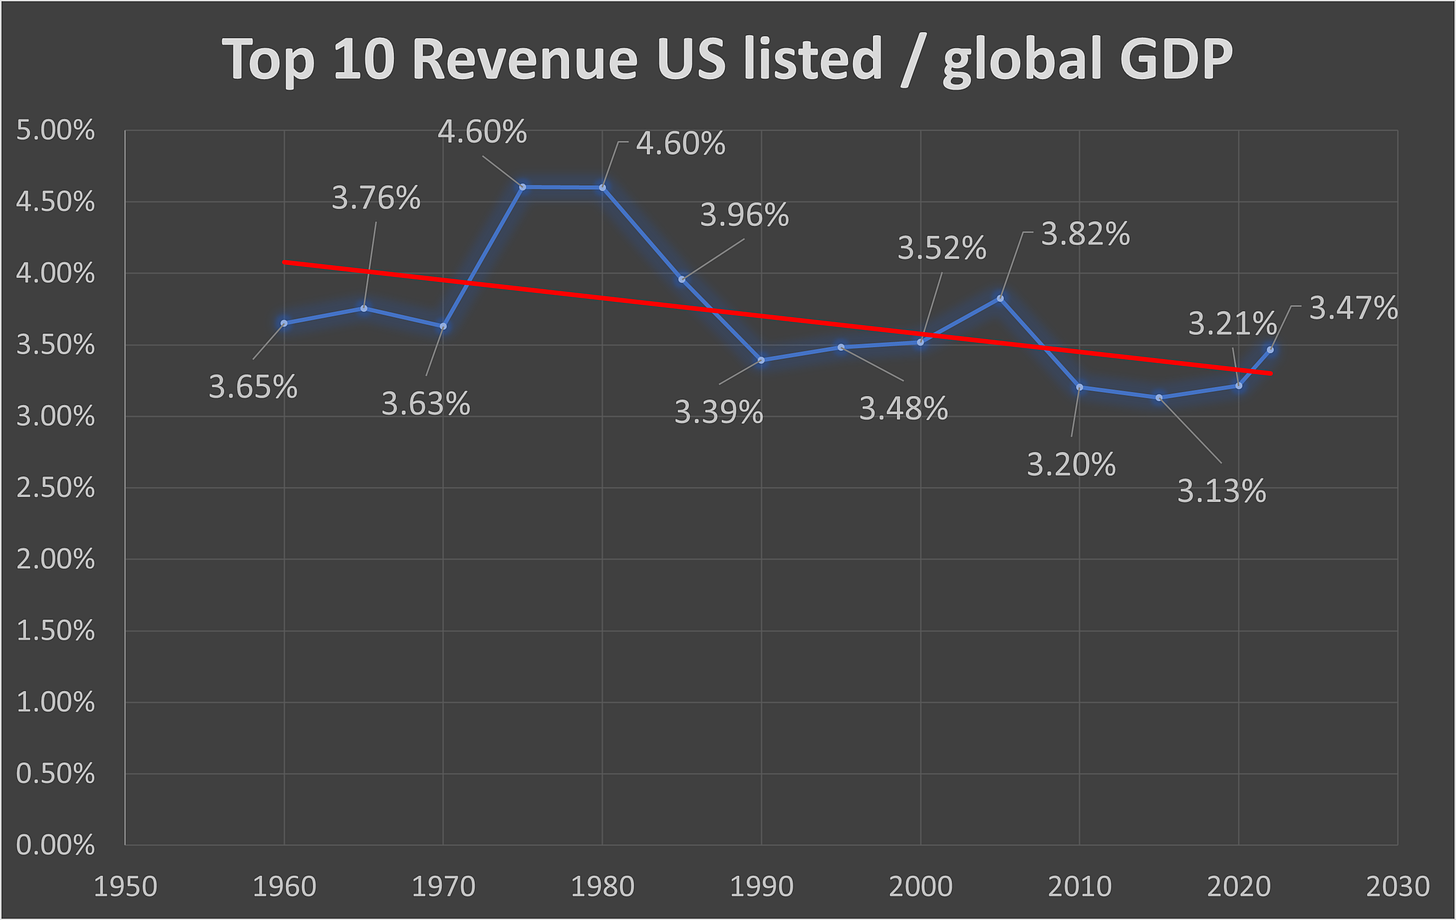
In 1960 the US accounted for an astonishing 40% of global GDP, which helps to explain the higher figures in the past.
The drop since 2010 is thanks to Walmart’s (the biggest company by revenue) anemic growth. Once Amazon takes the top slot in 2024/2025 we can expect the trend to turn upwards. Here’s the same chart since 1990:
Here’s another chart showing the revenue of the top 10 US listed companies by revenue divided by global GDP since 1960:
And the same chart since 1990:
Isn’t it surprising how tight the range has been over such a long period?
The Conference Board forecasts real GDP growth of 2.1% in 2023 and 2.6% through 2032. Those figures seem reasonable to me. I’m going to further assume we have 2.5% annual inflation between now and 2032. Global GDP is expected to finish this year around $104T. Now we can calculate expected GDP in 2032.
If we use the upper and lower bounds from the charts above to create an expected range of revenue for the largest company and 10 largest companies combined in 2032 (I used the 1990 and onward version), we get the following:
Top company upper bound: .74% of GDP = $1.26T
Top company lower bound: .58% of GDP = $987B
Top 10 companies upper bound: 3.82% of GDP = $6.5T
Top 10 companies lower bound: 3.13% of GDP = $5.33T
Hopefully I’m still writing this Substack in 2032 and can come back and see how close these figures are.
For reference, $1.26T in revenue represents a growth rate of 9.64% annualized for Amazon, and $987B represents a growth rate of 6.99%.
Let’s revisit the list of top companies by revenue:
2022 is the first year in which 4 tech giants make the top 10. Only Apple made the list in 2015. In 2032 it seems likely that there will be yet more tech companies in the top 10.
Market cap
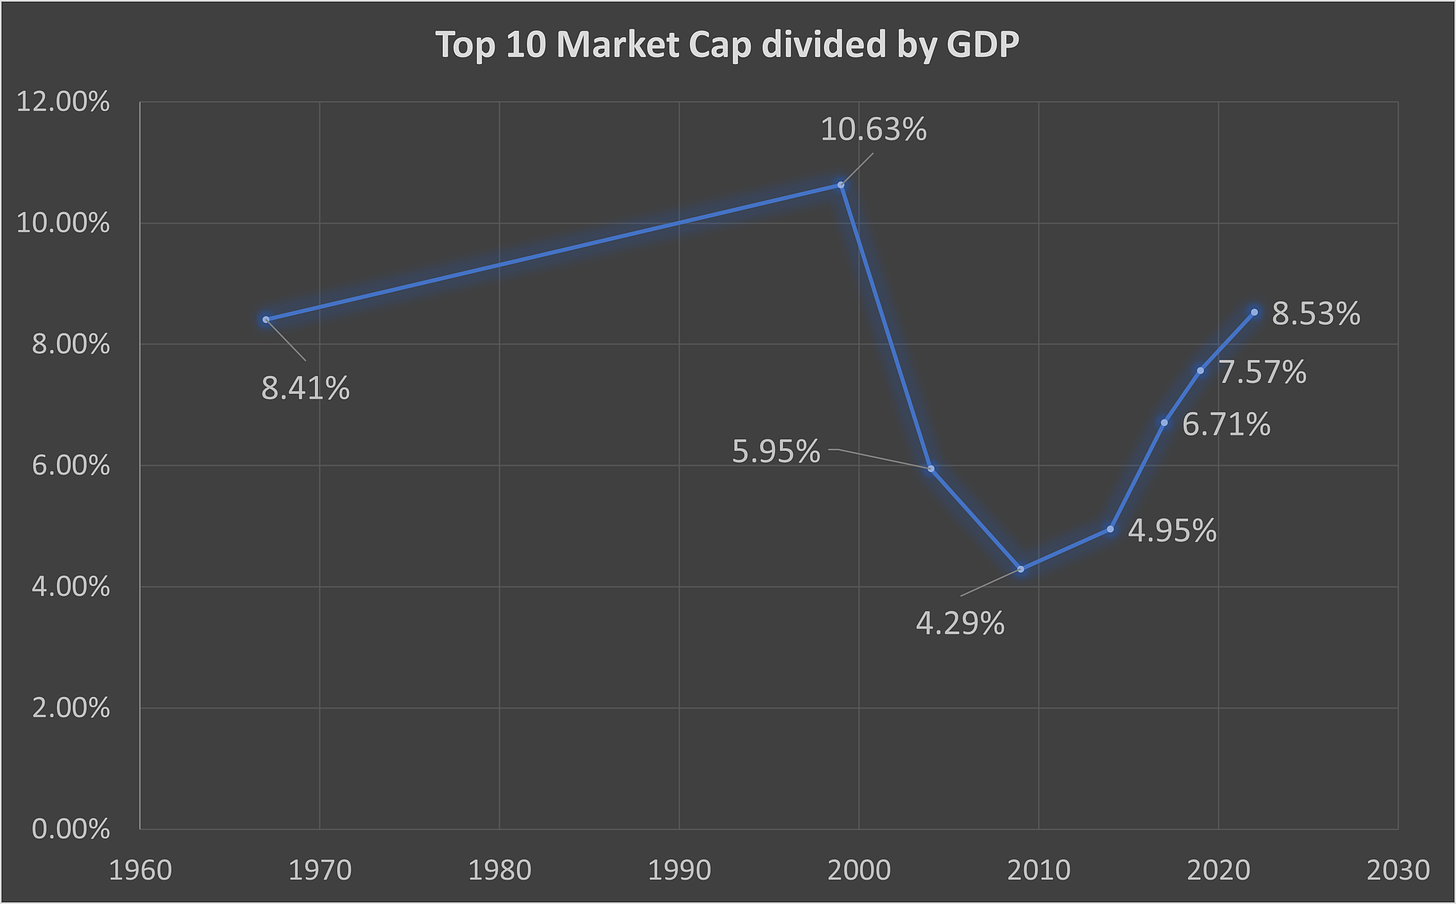
If anything is out of line compared to historical norms it is market cap - though not by as much as you might think.
I found these two interesting graphics which illustrate the largest companies by market cap over different time frames:
I adjusted the market caps for inflation and then calculated the ratios as a percent of global GDP as I did with the metrics in other sections above. Here’s the result:
As you would expect the peak occurred during the bubble of 1999 and the bottom occurred during the trough of the Great Financial Crisis. While we have experienced what looks like explosive growth since, we’re only just now getting back to where we were in the late 1960s.
That’s all for now.









Great visuals!
Thank you Nick!