Google has 9 products with over 1 billion users - how effectively is it monetizing those hours?
How do they compare against Apple?
In a previous post (linked here) I did a calculation to estimate the total time spent across Apple’s ecosystem of products. The result was a little north of 3 trillion hours on an annualized basis using my expectations for active devices as of December 2022 (and various assumptions about time spent per device from consumer surveys which I reference in the post).
In this post I’m going to do some similar calculations for Google.
Google has 9 products with more than 1 billion users, they are:
Google Search - 3.6 billion+
Android - 3 billion+
Chrome - 2.65 billion+
Gmail - 1.8 billion+
Google Drive - 1 billion+
Google Maps - 1 billion+
Google Play Store - 2.5 billion+
You Tube - 2.1 billion+
Google Photos - 1 billion+
Other products that have yet to hit the billion user count but which are over 100 million include:
Google Translate
Google Calendar
Google’s suite of office products (docs, sheets, etc)
Google Meet
Google Cloud (indirectly if you count people using products which are hosted on or otherwise touched by a Google Cloud service)
For reference, Google calls Gmail, Calendar, Drive, Docs, Sheets, Slides and Meet its “Workspace productivity Apps” - collectively they count more than 2.6 billion monthly active users.
Time spent on Android OS
The most direct comparison we can draw between Google and Apple’s 3 trillion hour figure is to count time spent on devices that run on the Android operating system. Worth noting, there is a big difference between Android and iOS from the consumer’s perspective. The vast majority (if not all) consumers who are using an Android phone think of themselves as using a: Samsung, or Xiaomi, or an OPPO phone, etc.
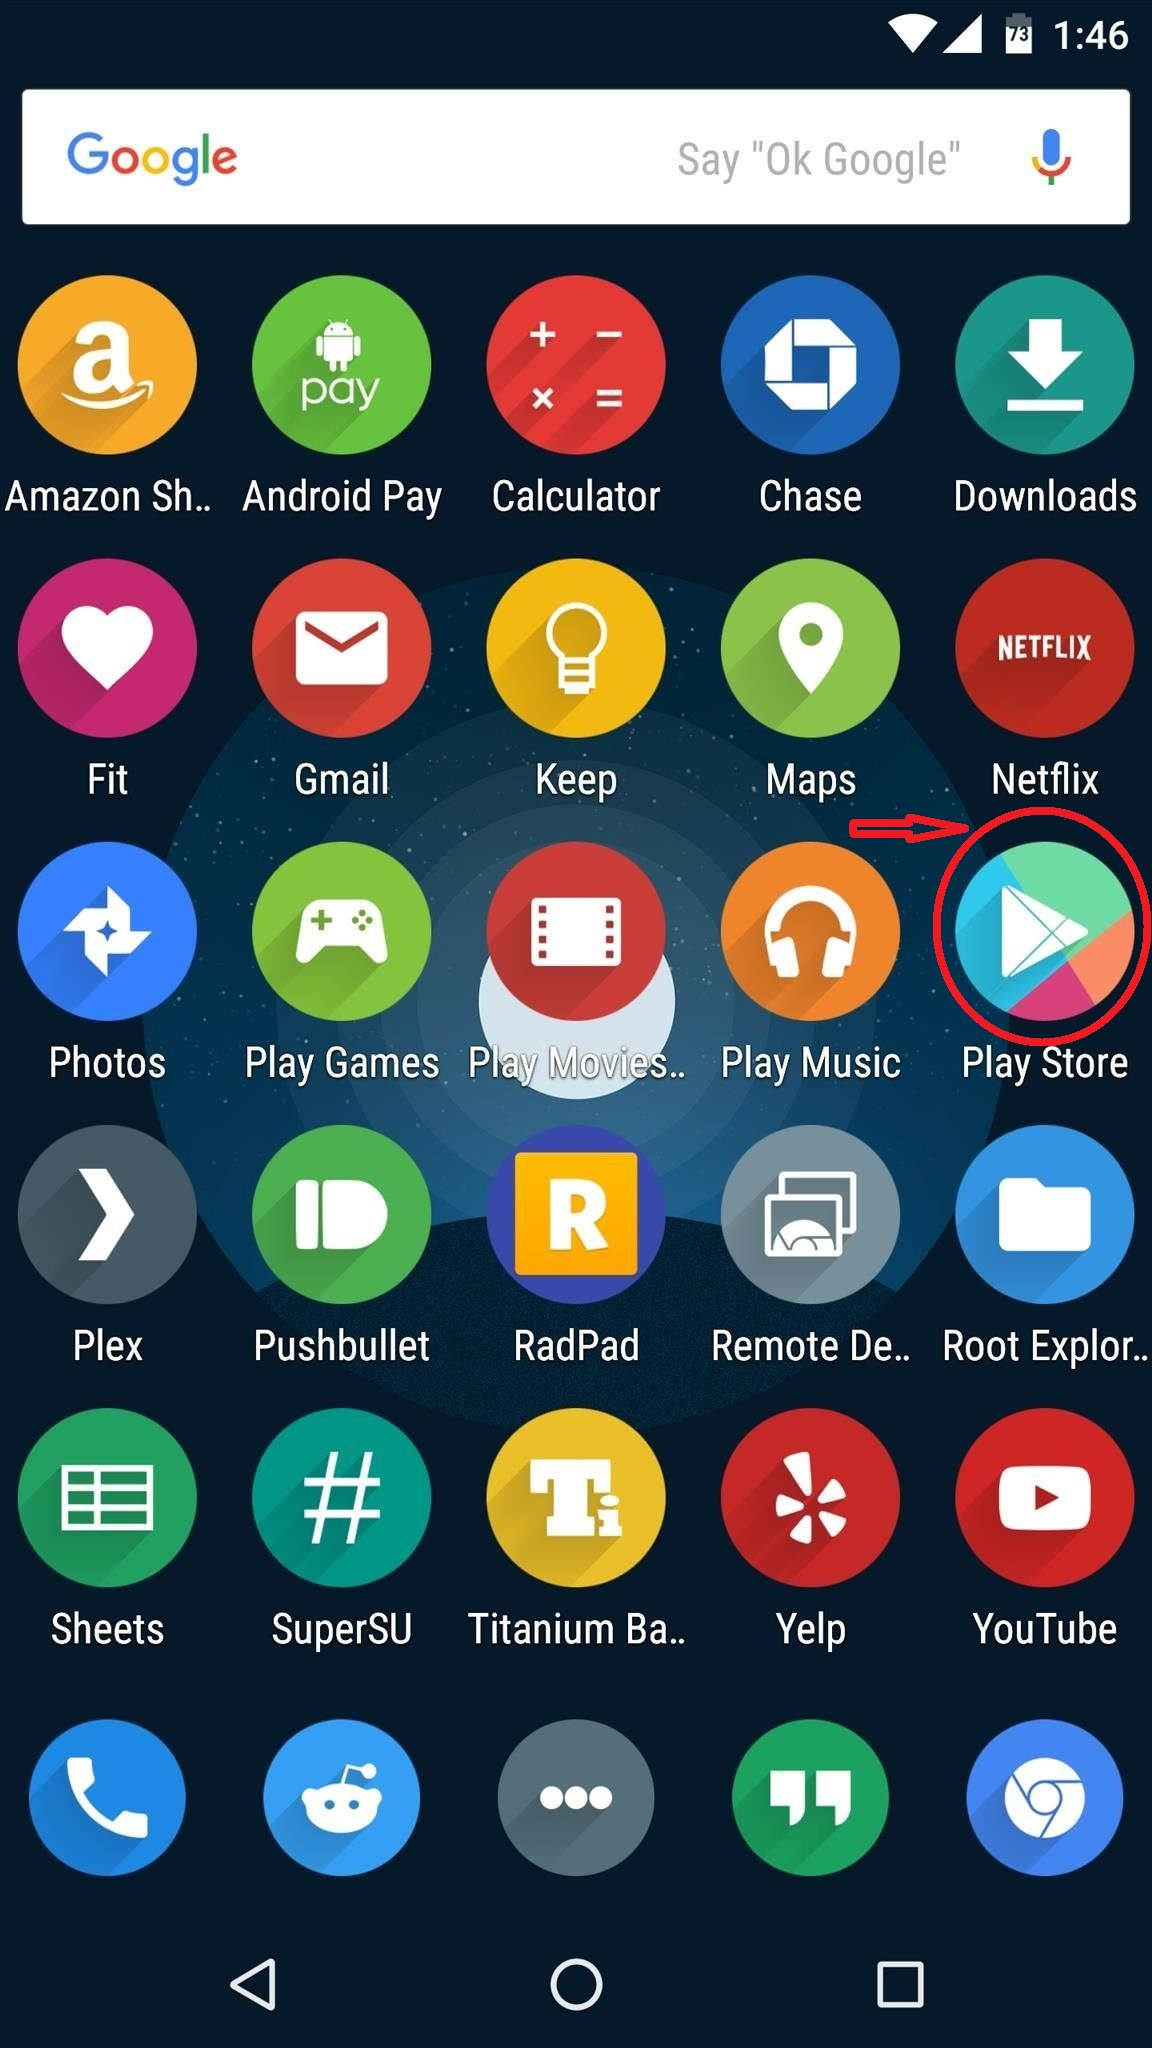
All of the Android users will be aware that they are purchasing Apps through the Google Play Store (see third row), and other hints abound in the user experience to remind people that they are using a product built on top of Android - but it still is not the same connection that Apple has with their users.
The estimates I found for time spent on smartphones ranged from 4-6 hours for millennials and older generations, and 6-8 hours for Gen Z. I used 6 hours to calculate total time spent on iPhones so I will use the same figure for Android. In practice, Android usage is likely to be higher than iPhone usage because Android users are more likely to be using their phones as their primary workstation (e.g. someone without a laptop in India).
Estimates for the number of Android smartphones in use I found hovered around 3 billion by end of 2022. Backing into the figure by looking at Android market share around 70% and a total smartphone user base (unique users) of just north of 5 billion would give us closer to 3.5 billion Android smartphones. I’ll use the 3 figure to be conservative.
For reference, I found this from 9to5google.com that estimated there were an additional 1 billion new Android devices activated between May 2021 and May 2022. This means that even if the 3.5 billion figure is high, it won’t be for much longer.
As to the calculation:
3 billion X 6 hours = 18 billion hours per day on Android smartphones
18 billion X 365 = 6.57 trillion hours per year
So, using smartphones alone (which don’t include Chromebooks, tablets built on iOS, etc) - we can estimate that total time spent on Android devices is at least 2.2X that spent on Apple devices.
Time spent on Chrome browser (only on laptops/desktops)
The second largest time share is use of Google’s Chrome browser. I found estimates that ranged from 65% market share to 77% market share if you look only at desktops. Let’s use the 65% figure to be conservative.
I found estimates from 2019 that there were around 2 billion computers worldwide.
I don’t know about you, but I NEVER have my computer on without having a browser open. My guess is that most people are the same. The average number of hours a knowledge worker uses a computer is 5 hours per day. I’m going to chop this figure in half to be conservative. This gives us the following:
.65 X 2 billion = 1.3 billion X 2.5 hours = 3.25 billion hours per day.
3.25 billion hours per day X 365 = 1.18625 trillion hours per year.
Time spent on YouTube
Among the other products with 1 billion + users YouTube has the third-largest time share. Remember that any Android users would be double counted, so we’re only interested in time spent using Google products on other platforms (iOS, desktop/windows, etc).
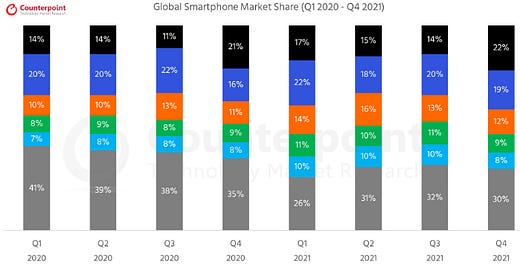
YouTube has 2.5 billion active users, who collectively watch about 1 billion hours of video every single day. An estimated 63% of this view time is from mobile devices. We can now calculate how much time is spent watching YouTube on Apple smartphones using the market share data above (22%).
1 billion X .63 = 630 million X .22 = 138,600,000 hours per day.
138,600,000 X 365 = 50,589,000,000 hours per year.
The other 37% of time is spent watching on PCs, and Google’s Chrome OS has about 2.5% market share, which leaves .975 X 37 = 36.075% of time spent watching YouTube on devices that are not running on a Google OS - and which hence count toward our final figure.
1 billion X .36075 = 360,750,000 hours per day and 131,673,750,000 (131.7 billion) per year.
Total Time
We now have the following:
6.57 trillion hours from Android
1.19 trillion hours from Chrome
.182 trillion hours from YouTube
Total Hours so far: 7.942 trillion hours.
I think it’s safe to say that if you include use of other Google products NOT being used on an Android OS we can get to 8 trillion hours per year.
Comparing Monetization of Apple and Google
From my post on Apple’s monetization of time spent we learned the following:
Apple is expected to make about $390 billion in revenue this year. This means they are monetizing time spent on their devices at a rate of $0.128 cents per hour.
Apple’s profit is expected to come in around 97.5 billion, which equates to profit per hour of $0.032.
Google is expected to have around $300 billion in revenue this year and around $75 billion in profit. This gives us the following:
Revenue per hour of time spent: $0.0375
Profit per hour of time spent: $0.0094
We can also calculate Apple and Google’s valuations in terms of hours spent across their respective ecosystems using the formula: Market Cap / Hours
For Apple the figure is: $0.779
For Google the figure is: $0.1475
Feels like there’s more meat on the bone doesn’t it?


i am quiet interested in the number: 3.6+b of google search, how did you count this number?
there's plenty of meat left on the bone. google's craft is narrowing your search field from infinity down to 6 choices simply by sorting things through page rank and traffic.
Apple's value is narrowing the search field from 6 down to 3. much of the value is often attributed to how "willing to spend" the rich iphone owners are but it's not so much self-selection as the positive correlation that superior UI/UX provide considerable cognitive value to decision making. That value is highlighted in shannon entropy when you can toggle the log base. H=-p * log6(p)