My definition of a synthetic monopoly (henceforth SM) is any small grouping of companies that are capturing the vast majority of economic benefit from a certain business model/product/service, and which collectively have an extremely low likelihood of being disrupted by companies outside of the group (regulation more likely). Further, an SM is likely to maintain or increase its collective market share while simultaneously maintaining or increasing its collective (and attractive) profit margins.
The difference between an SM and an oligopoly is that many oligopolies do NOT have the attractive characteristics one would expect from a monopoly. For example, Boeing and Airbus are an oligopoly without threat of disruption, but neither company has the profit margins, EPS growth or revenue stability of a monopoly, NOR would they have those characteristics when looked at as if they were a hypothetical single entity. Here’s what I mean.
IF Boeing had great financials and Airbus had terrible financials, and IF when we combined their financials and created pass-through financial statements they looked attractive, THEN they would qualify as an SM. Alas, neither company is attractive so the combined entity would also be unattractive.
Verizon, AT&T and T-Mobile are another example of an oligopoly that wouldn’t qualify as an SM.
Generally speaking, the market is well aware of which companies are SMs and has rewarded them with high valuations and multiple expansion that in most cases has enabled their stocks to keep pace with the QQQ (or surpass it) - which is quite a remarkable feat given its Big-Tech driven performance over the past ten years.
I thought I’d do a post where I track any synthetic monopoly I run across, and offer brief commentary to help people decide whether they’d like to dig deeper. Also, please reach out and let me know if I’ve missed any that are worth adding. The list is ordered by the average market cap size of the synthetic monopoly’s constituents. More will be added over time but I wanted to get this out there since it was already getting long.
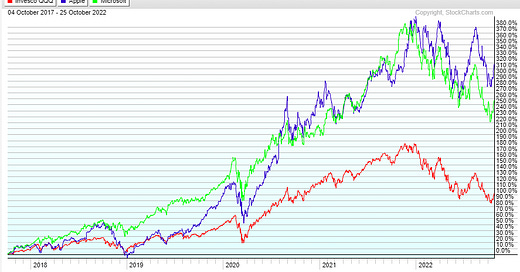
Computer operating systems
Microsoft: 76% market share
Apple: 15.3% market share
SM: 91.3%
Commentary: The main thing to point out here is that Microsoft has a multi-decade track record of using their operating system to sell-through other products and services. Apple’s Mac business success seems to be more driven by [how well the ecosystem works together] and [the success of the iPhone], much like the Apple Watch and Airpods (don’t hate me for this take, if you disagree I’d love to hear why - please let me know in the comments!) Also, see my comments in next section on the potential for a new VR/XR headset from Apple which are relevant both to that section and this one.
5yr chart vs. QQQ:
MSFT PE LTM a/o 2017: 22.8 MSFT PE LTM today: 26.1
MSFT PE NTM a/o 2017: 22.4 MSFT PE NTM today: 23.7
AAPL PE LTM a/o 2017: 18.3 AAPL PE LTM today: 25.2
AAPL PE NTM a/o 2017: 15 AAPL PE NTM today: 24.5
Mobile operating systems
Google: 71.6%
Apple: 27.8%
SM: 99.4%
Commentary: Disruption of this SM will come from regulation, not competitors. The wildcard is Meta’s XR bet, but we’re many years away from finding out whether it will amount to anything capable of dethroning these Godzillas. The optionality from owning a mobile operating system is (I believe) still hugely under estimated. Expect the TAM to keep surprising to the upside.
I also want to comment briefly on the Meta quest pro. I used it for the first time and here are some takeaways:
This form factor will be a game-changer, first for productivity and secondarily for entertainment.
If memory serves, I think I’ve read a stat that most computers are actually purchased by companies (it might have been specifically referring to desktops). Due to the price of these headsets, it seems logical that businesses seeking out productivity improvements from more flexible and larger screens will be a larger market than gaming over the next few years, especially w/ the new Microsoft announcement. Spending $1500 is a drop in the bucket if you improve your employees’ efficiency by even a smidge (engineer cost $~200k+/yr).
It is comfortable and powerful enough to replace computer monitors (though applications/software aren’t there yet and hardware still needs polishing). As one example, there isn’t yet a way to just port your phone screen into the device so you can easily check messages/respond to texts. Undoubtedly when Apple launches their headset it will have a seamless screen mirroring function.
It can be worn for hours without fatigue or causing pressure spots on your face/head. I was mostly looking at a developer environment, with three huge monitors in front of me, set to the backdrop of being on a peaceful beach. The background of the screens was black but colors/contrast were plenty good to use for extended periods. My buddy has been regularly using it to code for 3 hour stints per day.
What isn’t obvious is that Meta will win this new form factor (my optimistic case isn’t that they beat Apple, but that they own the equivalent of Android from years ago before Android became ubiquitous, i.e. before it’s moat was even remotely as strong as it is today). What IS completely obvious is that no matter what happens, Apple will have a new major product category. Consider that 88% of Gen Z uses and iPhone and 98% of Gen Z (within the US) would purchase an iPhone for their next phone if they could afford it. Gen Z are the overwhelming users of VR for entertainment and just “hanging out”. New generations love to have their own thing that the “olds” don’t use - so I see them adopting VR at a much higher rate than the millennial and older generations.
Having yet one more device in the Apple ecosystem that works seamlessly with the other devices will just make the entire ecosystem stronger. Apple has no brand issues, and they already OWN Gen Z mindshare. Launching a successful headset has been set up on a tee for them.
5yr chart vs. QQQ:
GOOG PE LTM a/o 2017: 65.3 GOOG PE LTM today: 19.4
GOOG PE NTM a/o 2017: 28.4 GOOG PE NTM today: 16.8
AAPL PE LTM a/o 2017: 18.3 AAPL PE LTM today: 25.2
AAPL PE NTM a/o 2017: 15 AAPL PE NTM today: 24.5
*Note: Google sky high PE in 2017 was probably due to a fine or write-off of some sort, didn’t look into it but obviously it’s off. Also, GOOG NTM PE likely higher than above as I expect analysts to downgrade estimates after 10/25 earnings call.
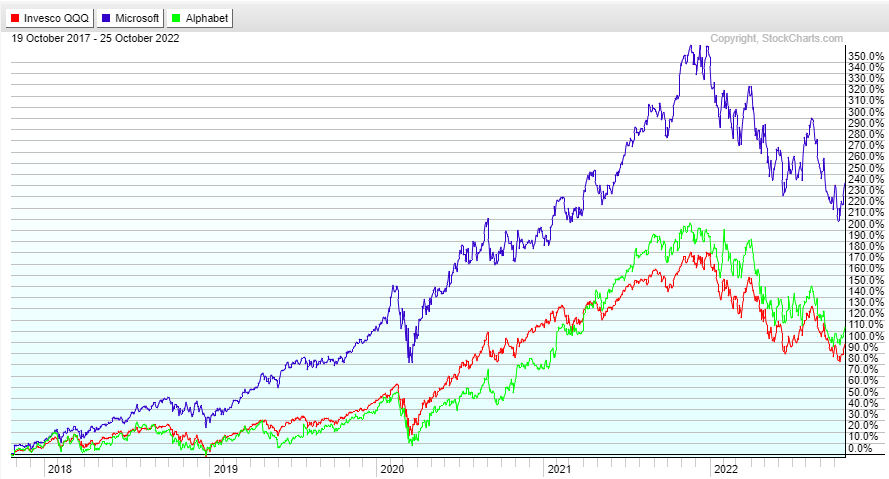
Productivity software
Microsoft’s Office 365: 65%
Google’s Workspace: 19.2%
SM: 84.2%
Commentary: Google’s advances here are impressive but I don’t see them as being a threat to Microsoft, it feels more like they’re just expanding the pie by having a lower cost offering, I doubt they’ve taken any dollars from Microsoft. Further, Microsoft seems to be innovating faster than Google in the space, and is the undisputed king of selling you five things because you already buy one (see the proliferation of Teams as an example).
5yr chart vs. QQQ
MSFT PE LTM a/o 2017: 22.8 MSFT PE LTM today: 26.1
MSFT PE NTM a/o 2017: 22.4 MSFT PE NTM today: 23.7
GOOG PE LTM a/o 2017: 65.3 GOOG PE LTM today: 19.4
GOOG PE NTM a/o 2017: 28.4 GOOG PE NTM today: 16.8
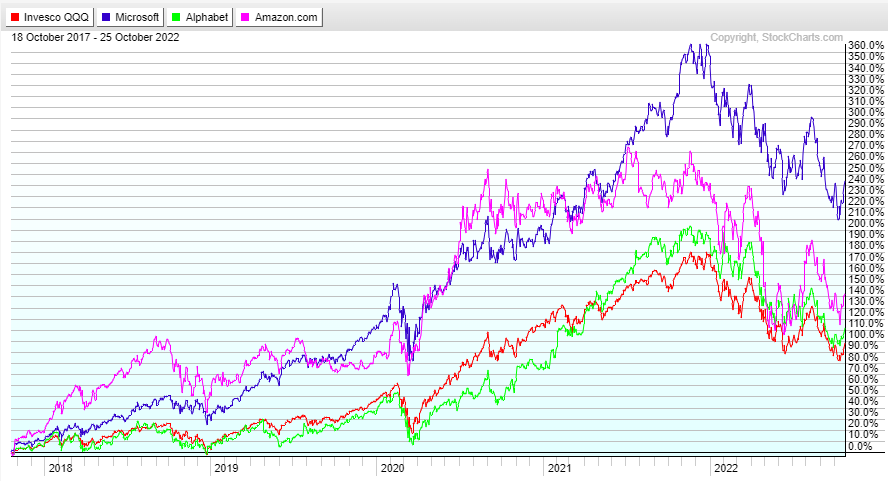
Cloud base-layer
Amazon’s AWS: 50.8%
Microsoft’s Azure: 33.8%
Google’s GCP: 15.4%
SM: 100%
Commentary: As you will see in the image below the above figures are not the share of the entire cloud infrastructure market. Rather, they are the split ONLY of what I call the base-layer companies, and there are only three worth mentioning (Amazon, Microsoft, Google). Oracle, IBM, Alibaba and a few other companies are attempting to compete at the base-layer but not successfully, and their breadth of service offerings, economies of scale, etc are not comparable to the base-layer companies. If you want to read more about the base-layer you can check out my post called: “How big could the cloud get?”
Within the base-layer Amazon is currently dominant, has more engineers familiar with its cloud ecosystem than anyone, and has the broadest portfolio of services built on top. It also appears to have some infrastructure advantages through its in-house chip business. That said, Microsoft is in a better position to act as a “one-stop-shop” for customers’ technology needs and hence has an enormous opportunity to sell-through cloud services to its existing customers - which is literally every business on Earth. Google’s cloud business doesn’t have any major advantages that I’m aware of (though it has what so far appear to be minor advantages at certain AI/ML applications and in selling-through to people who rely heavily on Google’s analytical data - especially ecommerce companies).
5yr chart vs. QQQ
MSFT PE LTM a/o 2017: 22.8 MSFT PE LTM today: 26.1
MSFT PE NTM a/o 2017: 22.4 MSFT PE NTM today: 23.7
GOOG PE LTM a/o 2017: 65.3 GOOG PE LTM today: 19.4
GOOG PE NTM a/o 2017: 28.4 GOOG PE NTM today: 16.8
AMZN PE LTM a/o 2017: 226 AMZN PE LTM today: 107
AMZN PE NTM a/o 2017: 172.4 AMZN PE NTM today: 77.2
Notes* AMZN PE’s are deceptive b/c Amazon has historically actively avoided reporting accounting profits and opted instead to invest in growth. Their seller services business, ads and Cloud account for an increasing share of revenue and all three are profitable. See charts from a different post of mine on the revenue mix-shift looking forward (profitable segments in blue, money-losing in orange):
Digital advertising
Google: 50.5%
Meta: 25.2%
Amazon: 8.2%
Microsoft: 2.7%
Apple: 1.1%
SM: 87.7%
Commentary: These companies account for near 100% of digital advertising profits. Their share of advertising generally and digital advertising specifically should continue to grow.
Crucially, any disruption in the digital advertising space is likely to result in money being transferred within this group of companies (the wildcard being TikTok). Apple’s IDFA measures mostly took revenue from Meta and sent it to Google and Amazon (and more recently Apple). If Apple were to ever launch its own search engine then revenue it captured (if any) would be transferred from Google to Apple.
Outside of “privacy” (*cough* bullshit *cough*, see more below) related changes to mobile-operating systems, my view is that the likeliest disruption to the digital advertising space in the 5 year-ish future will come from one of two places:
Truly personalized assistants (PAs) running on large language models
Messaging
Both PAs and messaging have the potential to start acting as a new layer that sits between us and:
Product/app discovery
Purchasing (everything from initial transaction through customer service and follow up)
Browsing/searching (for medical information, vacation ideas, etc)
Our relationship with businesses
Nothing terrifies tech giants more than another business getting between them and their relationship with users. The reason Apple went so hard after Meta (and it was going after Meta specifically, even though they would never admit it) was not privacy, it was because Meta was responsible for determining more than half of all downloads on the App store via their ads and other discovery taking place on Meta’s family of apps. Meta had become a layer between iPhone users and possibly the most crucial component of Apple’s moat - the App store. Apple hated this and was justifiably scared by that amount of power being in the hands of someone else, especially a proven operator like Mark Zuckerberg.
5yr chart vs. QQQ
GOOG PE LTM a/o 2017: 65.3 GOOG PE LTM today: 19.4
GOOG PE NTM a/o 2017: 28.4 GOOG PE NTM today: 16.8
META PE LTM a/o 2017: 34.7 META PE LTM today: 11.4
META PE NTM a/o 2017: 27.7 META PE NTM today: 15.7
AMZN PE LTM a/o 2017: 226 AMZN PE LTM today: 107
AMZN PE NTM a/o 2017: 172.4 AMZN PE NTM today: 77.2
MSFT PE LTM a/o 2017: 22.8 MSFT PE LTM today: 26.1
MSFT PE NTM a/o 2017: 22.4 MSFT PE NTM today: 23.7
AAPL PE LTM a/o 2017: 18.3 AAPL PE LTM today: 25.2
AAPL PE NTM a/o 2017: 15 AAPL PE NTM today: 24.5
*Note: Meta forward PE could be 20 or even higher given their new expense guide. Rumors inside the company are they will have layoffs even though they have committed only to “keeping headcount flat”, but if they don’t cut costs we could easily see a 20+ number on next year’s earnings.
Leading-node semiconductor fab (manufacturer)
Taiwan Semi: 100%
Commentary: Intel is not capable of making leading-node chips currently, and Samsung (the second largest fab) can’t get decent yields on its leading-node. The result is that NVDA/QCOM and pretty much everyone else has moved to TSM. The more complicated chips get the harder and more expensive it is to make them. Intel has a plan to catch up by 2024-2025 but I’m dubious they’ll be able to. Taiwan is one giant semiconductor subsidy, with high speed rail networks that have stops at the different fabs all over the country making it easier to move engineers to where they are most needed. During their recent drought fabs were able to keep the water on while the citizenry experienced rolling blackouts, could you imagine Americans being okay with their water getting turned off so Ford could keep making cars? Engineers in Taiwan work longer hours and get paid 70% (or less) compared to peers in the US and Europe even though they are just as talented. There’s also a “cultural subsidy” of sorts: in Taiwan there is no surer way of getting a good wife than being an engineer for TSM (I’m serious).
If TSM wasn’t based on Taiwan I believe it would be worth 3X what it currently is. TSM makes the chips that run our data centers, including the majority of chips from AMD and Nvidia, and even a big chunk of Intel’s chips (and more in the future, as Intel is outsourcing their 3nm since they can’t make it themselves). It makes all the chips that power Apple devices. It makes Qualcomm’s chips that power our cell phones, and a huge portion of the chips that run the world’s cars. If TSM is taken out of commission there would be an economic collapse greater than anything we saw in 2008/2009. For that reason (Obvious Mutually Assured Destruction) I don’t believe it would happen, even if China took over Taiwan. What is possible though under that scenario is that TSM starts to receive a “China discount” akin to what Alibaba has now.
5yr chart vs. QQQ
TSM PE LTM a/o 2017: 18.8 TSM PE LTM today: 10.8
TSM PE NTM a/o 2017: 16.9 TSM PE NTM today: 9.6
Note* TSM valuation is as inexpensive as it has ever been at the same time as it is more dominant than it has ever been. This valuation is due primarily to geopolitical risk.
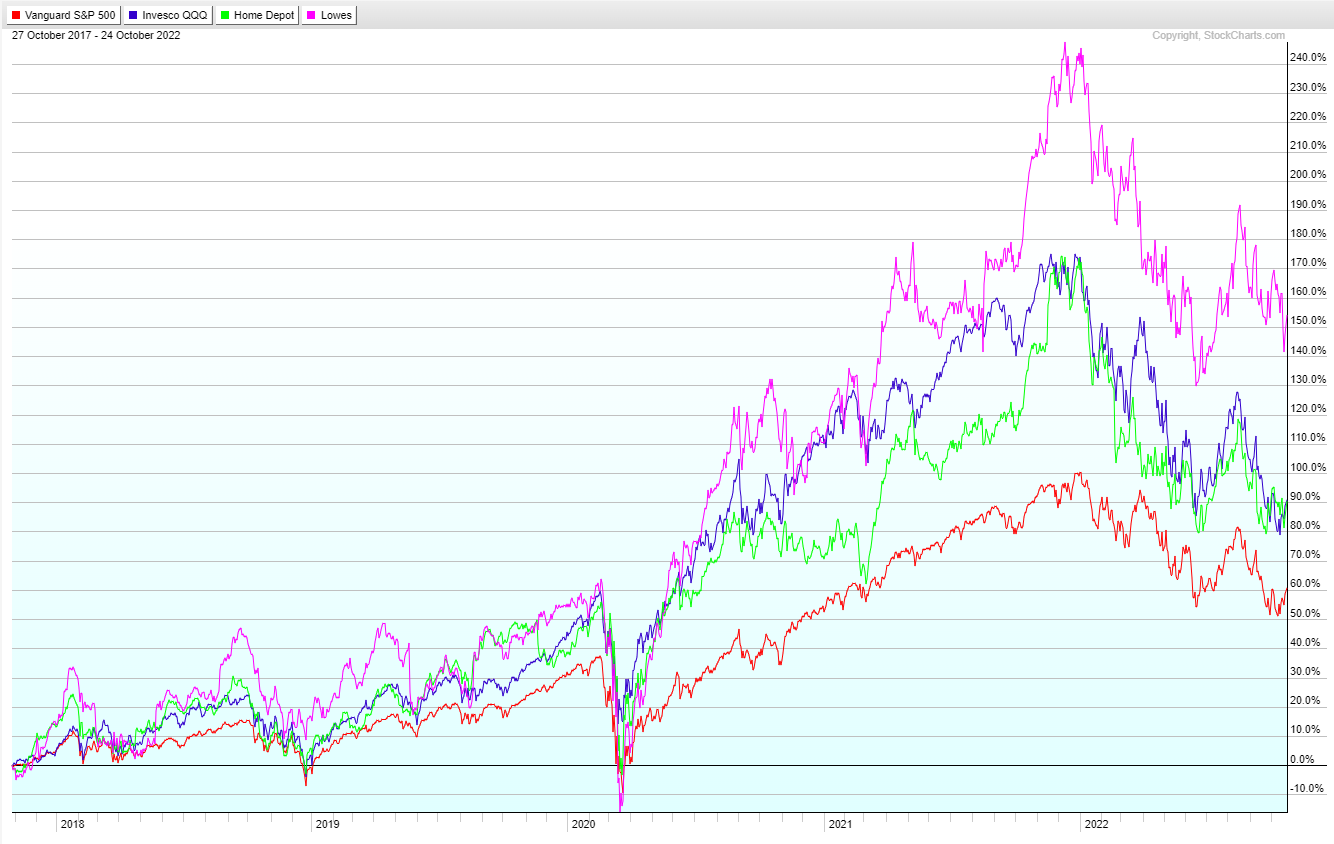
Home improvement
Home Depot: 19%
Lowe’s: 12%
Total: 31%
Commentary: The market shares above don’t represent the market power of these two companies. While there are many places to buy “home improvement” products, including Best Buy, Ace Hardware, Walmart, Amazon and so on - the type and breadth of product listings that Home Depot and Lowe’s have are unique, as are their supply chains and real estate/geographic footprint.
Here’s a 5 year chart of HD (green) and LOW (purple) against the S&P (red) and QQQ (blue):
Both companies gush cash and are friendly to shareholders. Both companies have been increasing margins steadily for years. Walmart, Amazon, BestBuy, Ace, etc are not even attempting to to build out a similarly comprehensive offering, so I think despite the collective 31% market share these businesses do qualify as an SM.
HD PE LTM a/o 2017: 22.5 HD PE LTM today: 17.9
HD PE NTM a/o 2017: 20.2 HD PE NTM today: 17.1
LOW PE LTM a/o 2017: 23.5 LOW PE LTM today: 15.4
LOW PE NTM a/o 2017: 18 LOW PE NTM today: 13.6
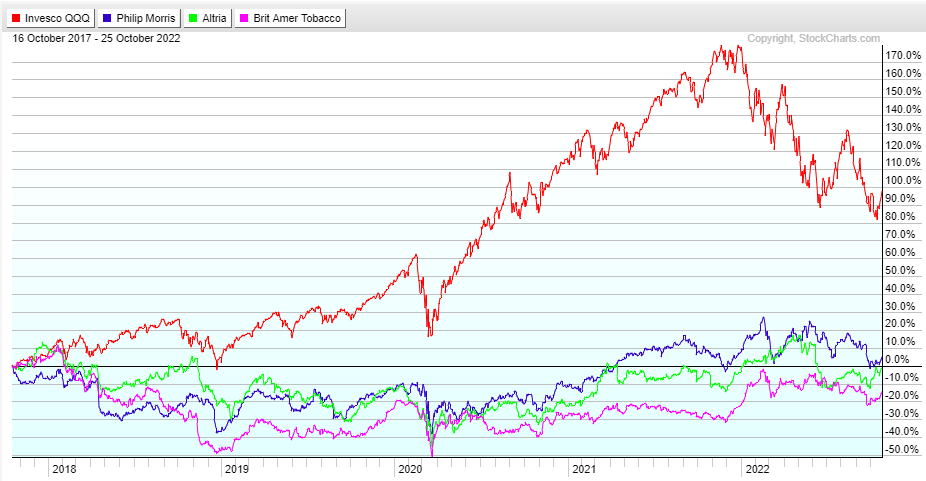
Tobacco
Altria
Phillips Morris
BTI
Commentary: Market shares of MO, BTI, and PM are tricky due to each businesses’ domination of certain geographies. While the margins of this group certainly indicate they have SM pricing power, they ARE facing significant secular headwinds. Like the railroads, sales have been mostly flat over the past ten years, but unlike the railroads these companies haven’t managed to increase EPS faster than the S&P. This shows up in the stock performance as you’ll see from charts below. Honestly, my personal view is they don’t deserve to be on the list but I went ahead and included them as I know many people are interested in the group. Note, the chart doesn’t include dividends, but the underperformance even with dividends is extreme.
5yr chart vs. QQQ
MO PE LTM a/o 2017: 13.2 MO PE LTM today: 47.9
MO PE NTM a/o 2017: 18.5 MO PE NTM today: 9.3
PM PE LTM a/o 2017: 25.9 PM PE LTM today: 13.7
PM PE NTM a/o 2017: 18.7 PM PE NTM today: 15.7
BTI PE LTM a/o 2017: 2.5 BTI PE LTM today: 13.6
BTI PE NTM a/o 2017: 14 BTI PE NTM today: 8.6
*Note, there must have been a transaction from BTI in 2017, and MO figures skewed by write-offs related to Juul and other (cannabis?) investments.
Payments
Figuring out market share here was tough. Payment volumes I found online but market share I pulled from someone on Twitter. If you know how to reconcile the figures please let me know in the comments.
Visa: 2021 payment volume $13.0T Market Share: 44%
Mastercard: $7.7T Market Share: 37%
American Express: $1.27T
Commentary: Visa and Mastercard really belong in their own category but I put American Express there for reference.
That said, it’s obvious Visa and Mastercard are dominant. Their net margins hover around 45-50% (in most recent quarter I believe V reported FCF of 60% of revenue or somewhere thereabouts), up 500 basis points in the past 7 years or so - exactly what you would expect to see from what might be the highest quality SM on earth. That said, I can’t wrap my head around their moats looking out ten years, and given their current valuations that’s an important thing to consider.
Their moats are built around having ubiquitous payment networks and being deeply engrained in business processes (e.g. Delta credit cards, bank debit cards, the basis for Apple/Google Wallet, etc). The potential issue I could see looking out 5-10 years is that there are multiple big tech companies who are every bit as ubiquitous as vendors who accept V/MA credit cards. To date, big Tech companies’ attempts at building out payment systems still rely on credit and debit cards, but that doesn’t mean they have to in the future. Everyone has either an iPhone or an Android (99% market share outside of China), this makes ALL companies who rely on network effects subject to disruption. Networks are far more valuable if they are the UNIQUE connector of a group. Nothing is unique anymore.
India launched their UPI payment system in 2016 and has grown at an annual rate of 160% since its launch in 2016 - hitting near $1T of volume last year. Visa and Mastercard don’t have a technological advantage, they just have network effects.
But even more worrisome (to me) is my belief that long term payment fees will head to zero. Consider that transaction data is the most valuable data on Earth. Apple’s privacy changes hurt digital ad companies so badly because they took away specific device ID purchase data. Facebook STILL knows your name, your friends, where you live, etc - they didn’t lose access to any of the truly personal information. What they lost access to is the knowledge that: “Device ID: 284723498237494237 has purchased 23 in-game items in the past 3 days on this casino game, and is therefore likely to download other casino-games in the next 24 hours”. This is another reason it is painfully obvious that Apple’s “Privacy Campaign” is a fraud - they aren’t protecting a single piece of truly personal information, what they’re blocking is data that was already anonymized.
Quick aside: If you’re interested in learning more about the privacy fraud read this NYT investigative report that explains how Apple has turned over not some, but ALL user data for iPhone/Mac customers in China to the CCP. The CCP has total control of and access to emails, text messages, images, contact lists, travel patterns, etc - for ANY Apple user in China. Apple doesn’t care about privacy, they - like any good company SHOULD - care only about their shareholders - and privacy was the perfect excuse to wreck competitors and take market share in a way that would have been impossible to get away with because of antitrust. Remember, it is hard to prove that anti-competitive measures taken by Amazon are hurting consumers because it offers the best combination of price, service and quality. It’s hard to prove that anti-competitive measures taken by Google hurt consumers because it’s free. On the other hand, it is plainly obvious that Apple destroying the digital ad ecosystem is hurting consumers because it results not in a reduction of the number of ads consumers see, but in a reduction of the relevance of those ads (essentially, it creates spam), while offering consumers no benefit in protecting truly personal information. Apple knew the only way they could escape regulators was to offer a plausible alternative motive.
Now back to the post.
Past purchases are the #1 best signal by far for future purchases. Because this data is so valuable it just seems like long term it will be monetized indirectly (e.g. through ads, or as a perk for subscribing to a broader ecosystem to make it stickier). V and MA have a combined $740B market cap - big market caps attract the attention of the Tech Giants. I’m sure there will be a market for payment processing that is privacy focused, but I don’t have a good idea about how big that market is as a percent of the total.
Would love to hear counter arguments on this view. Also, FWIW I would LOVE to buy V and MA if their prices came down, I don’t see this disruption taking place quickly, and they will probably remain absurdly profitable for years after the potential disruptors have made their first moves.
V PE LTM a/o 2017: 39.1 V PE LTM today: 29.9
V PE NTM a/o 2017: 27.4 V PE NTM today: 25.2
MA PE LTM a/o 2017: 47.4 MA PE LTM today: 32.9
MA PE NTM a/o 2017: 31.2 MA PE NTM today: 28.7
More will be added over time. Stay tuned, and please let me know if there are some new SMs you’d like to see me ad.







ASML - a monopoly.